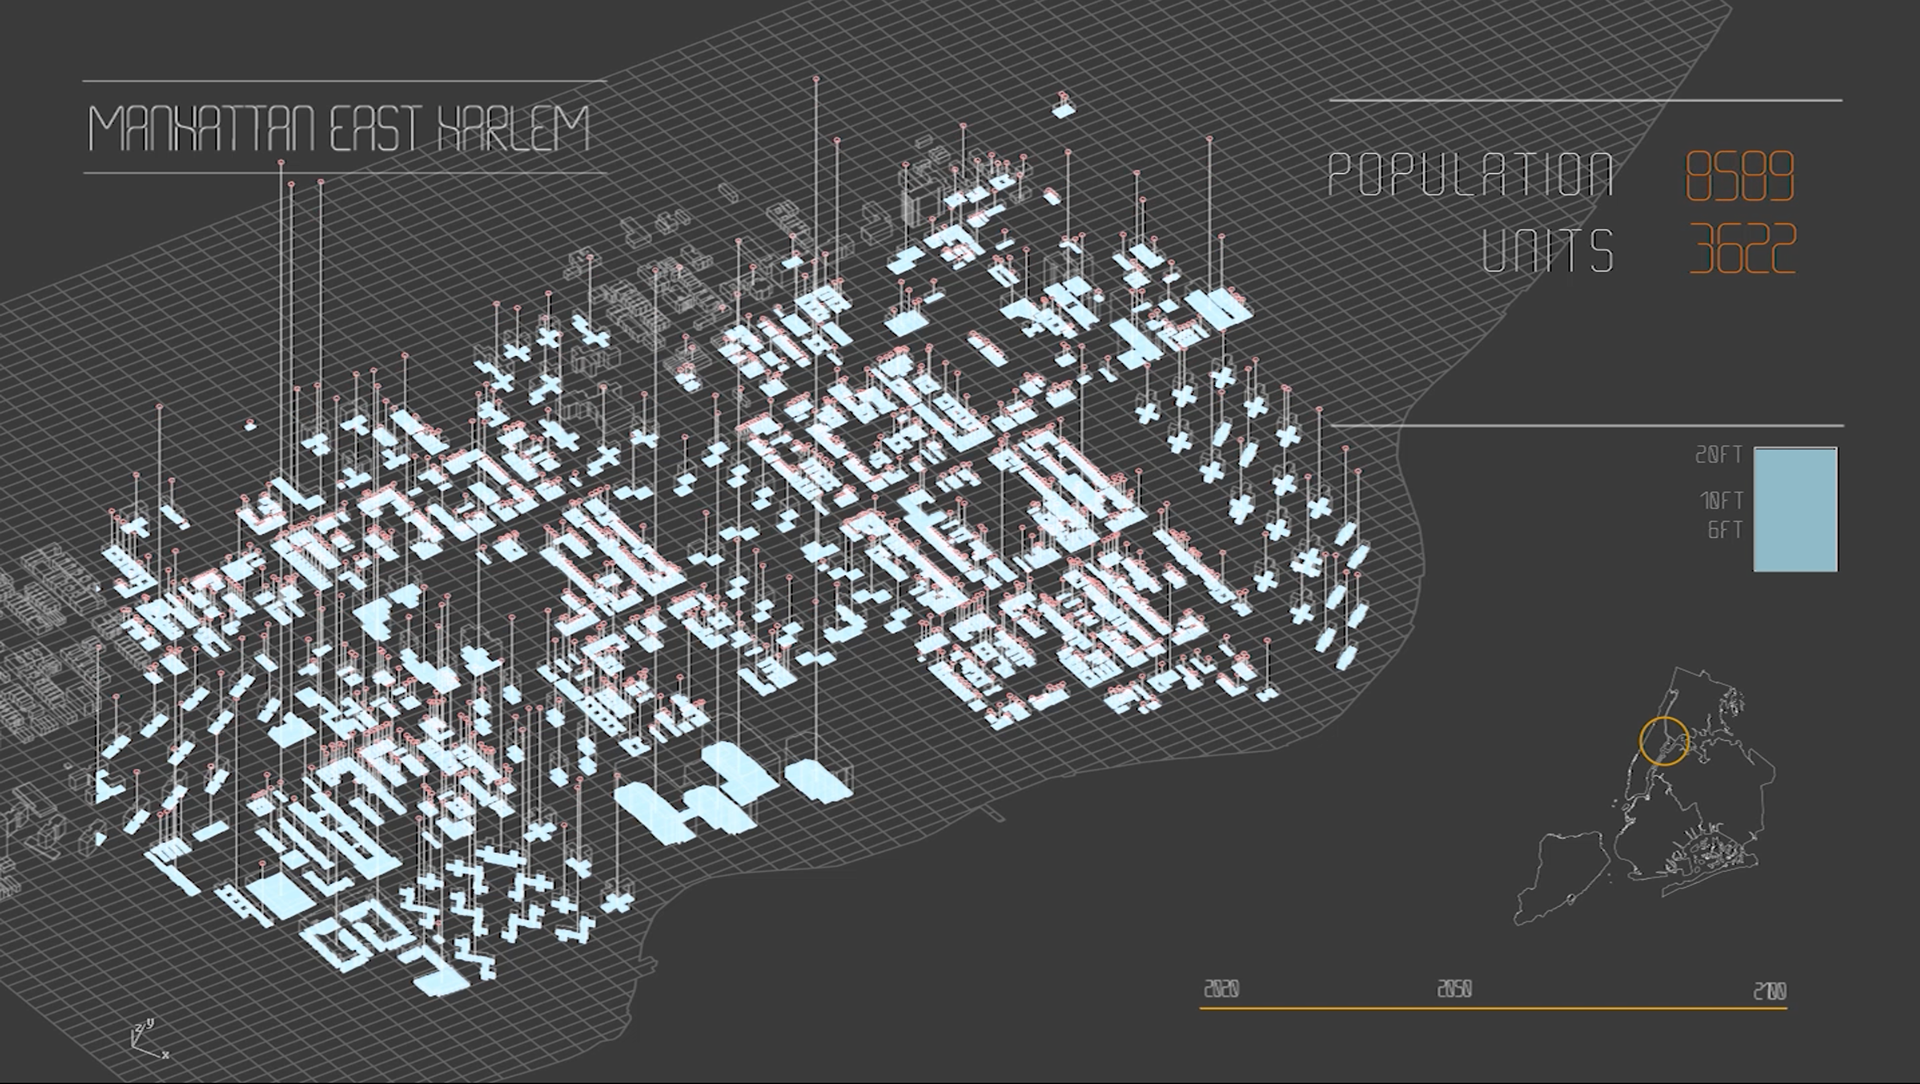
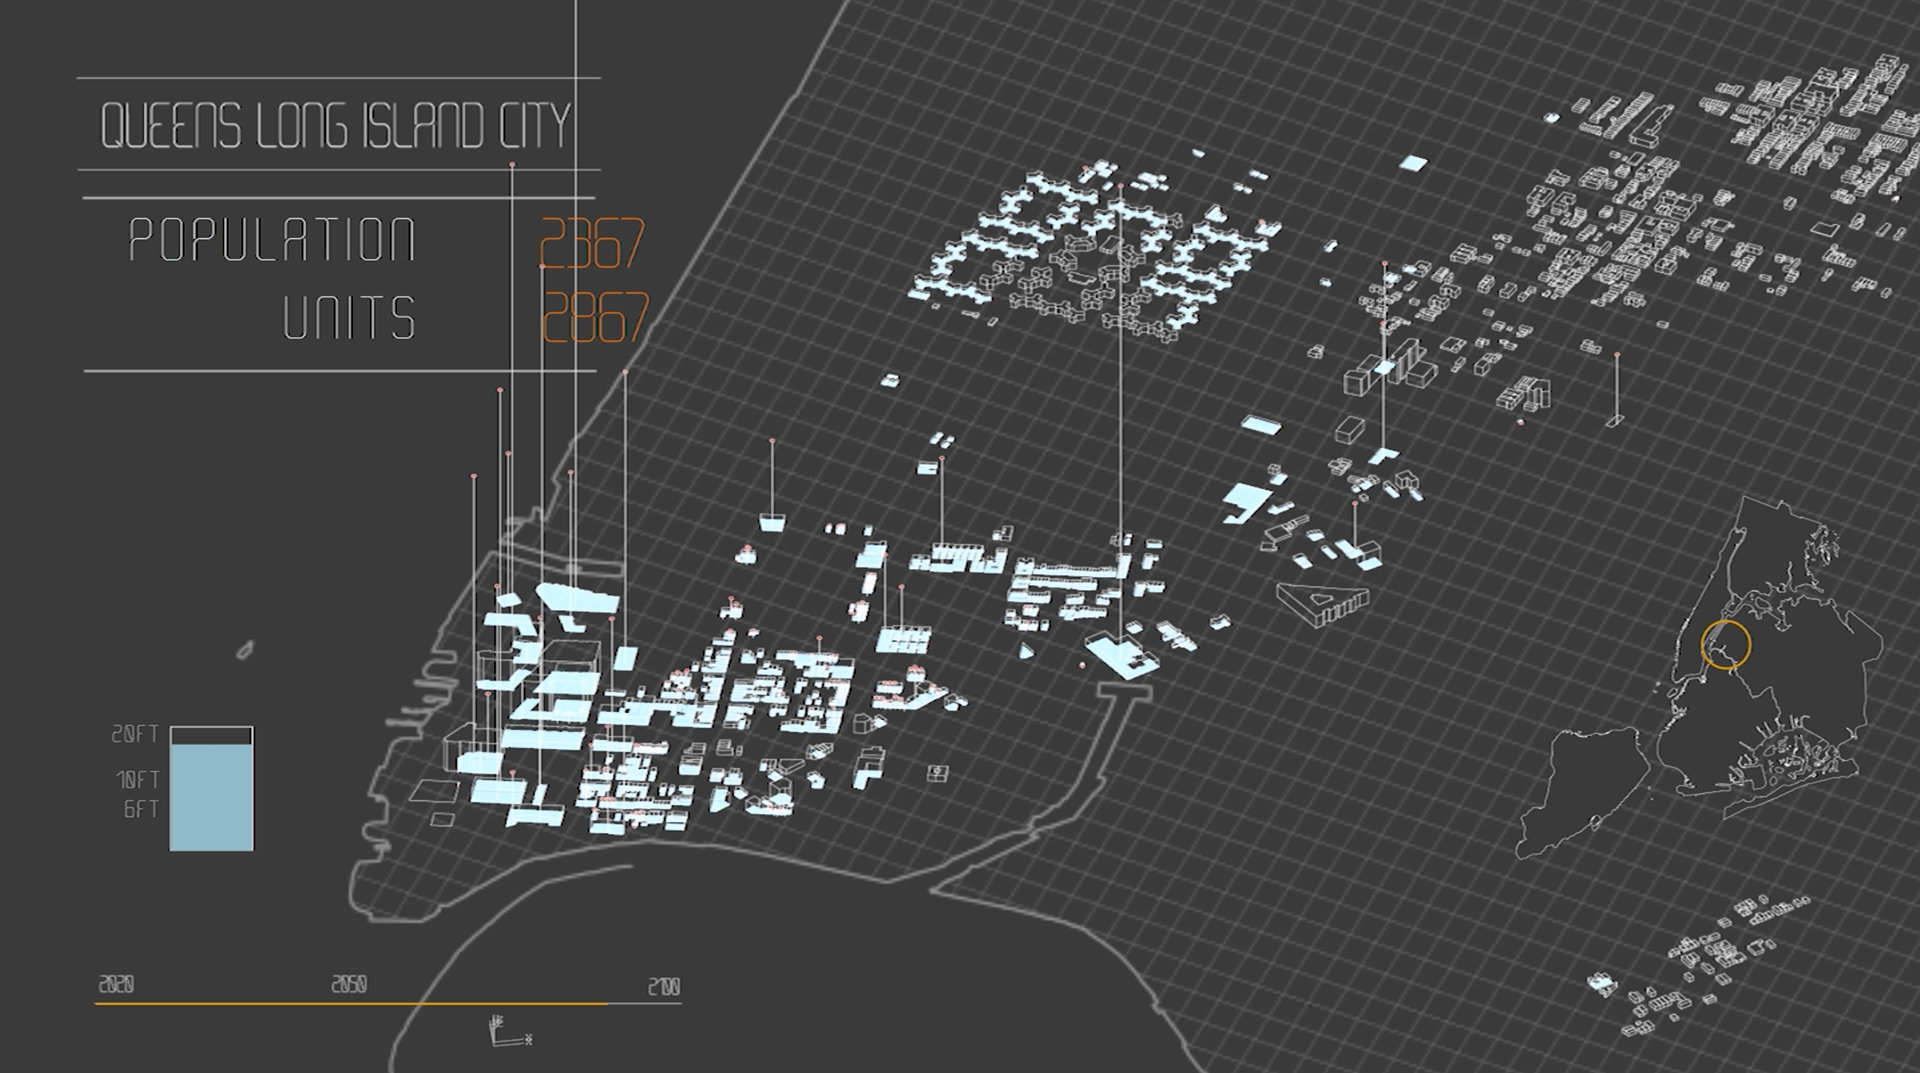
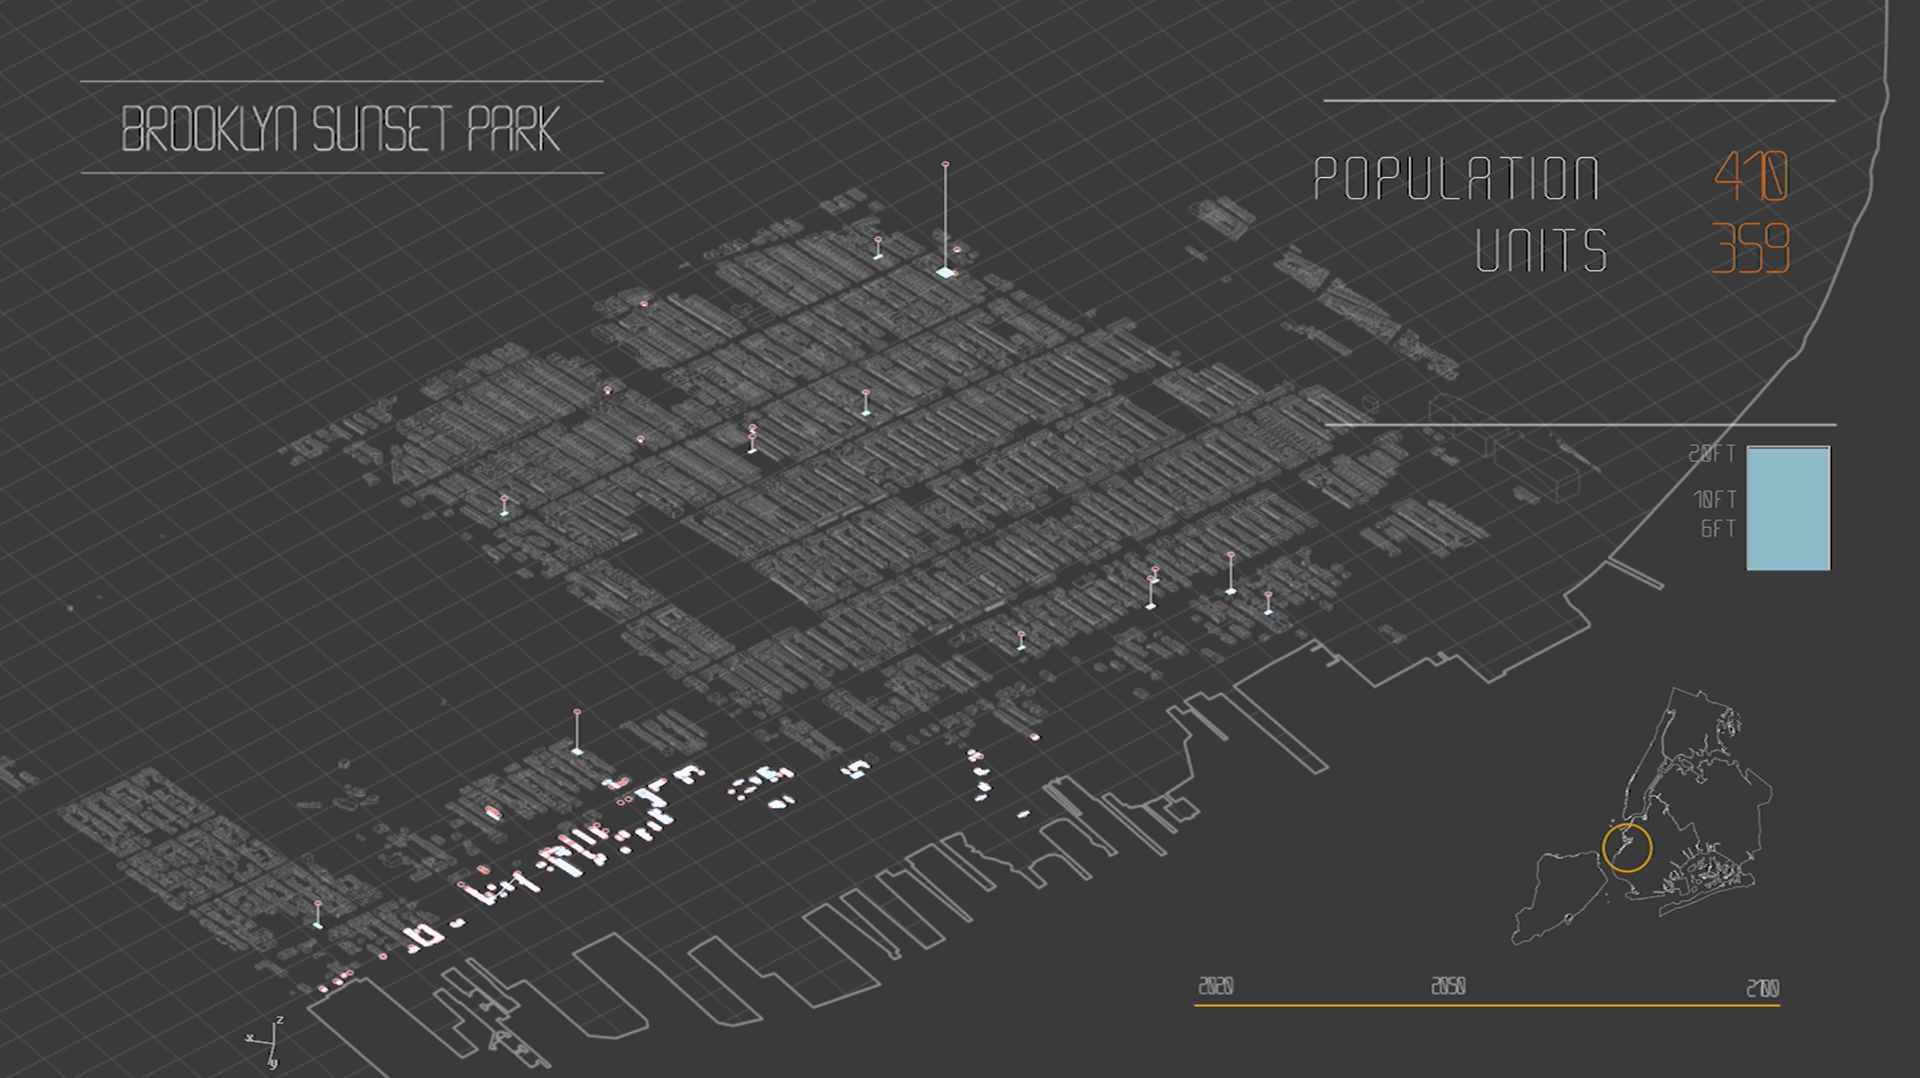
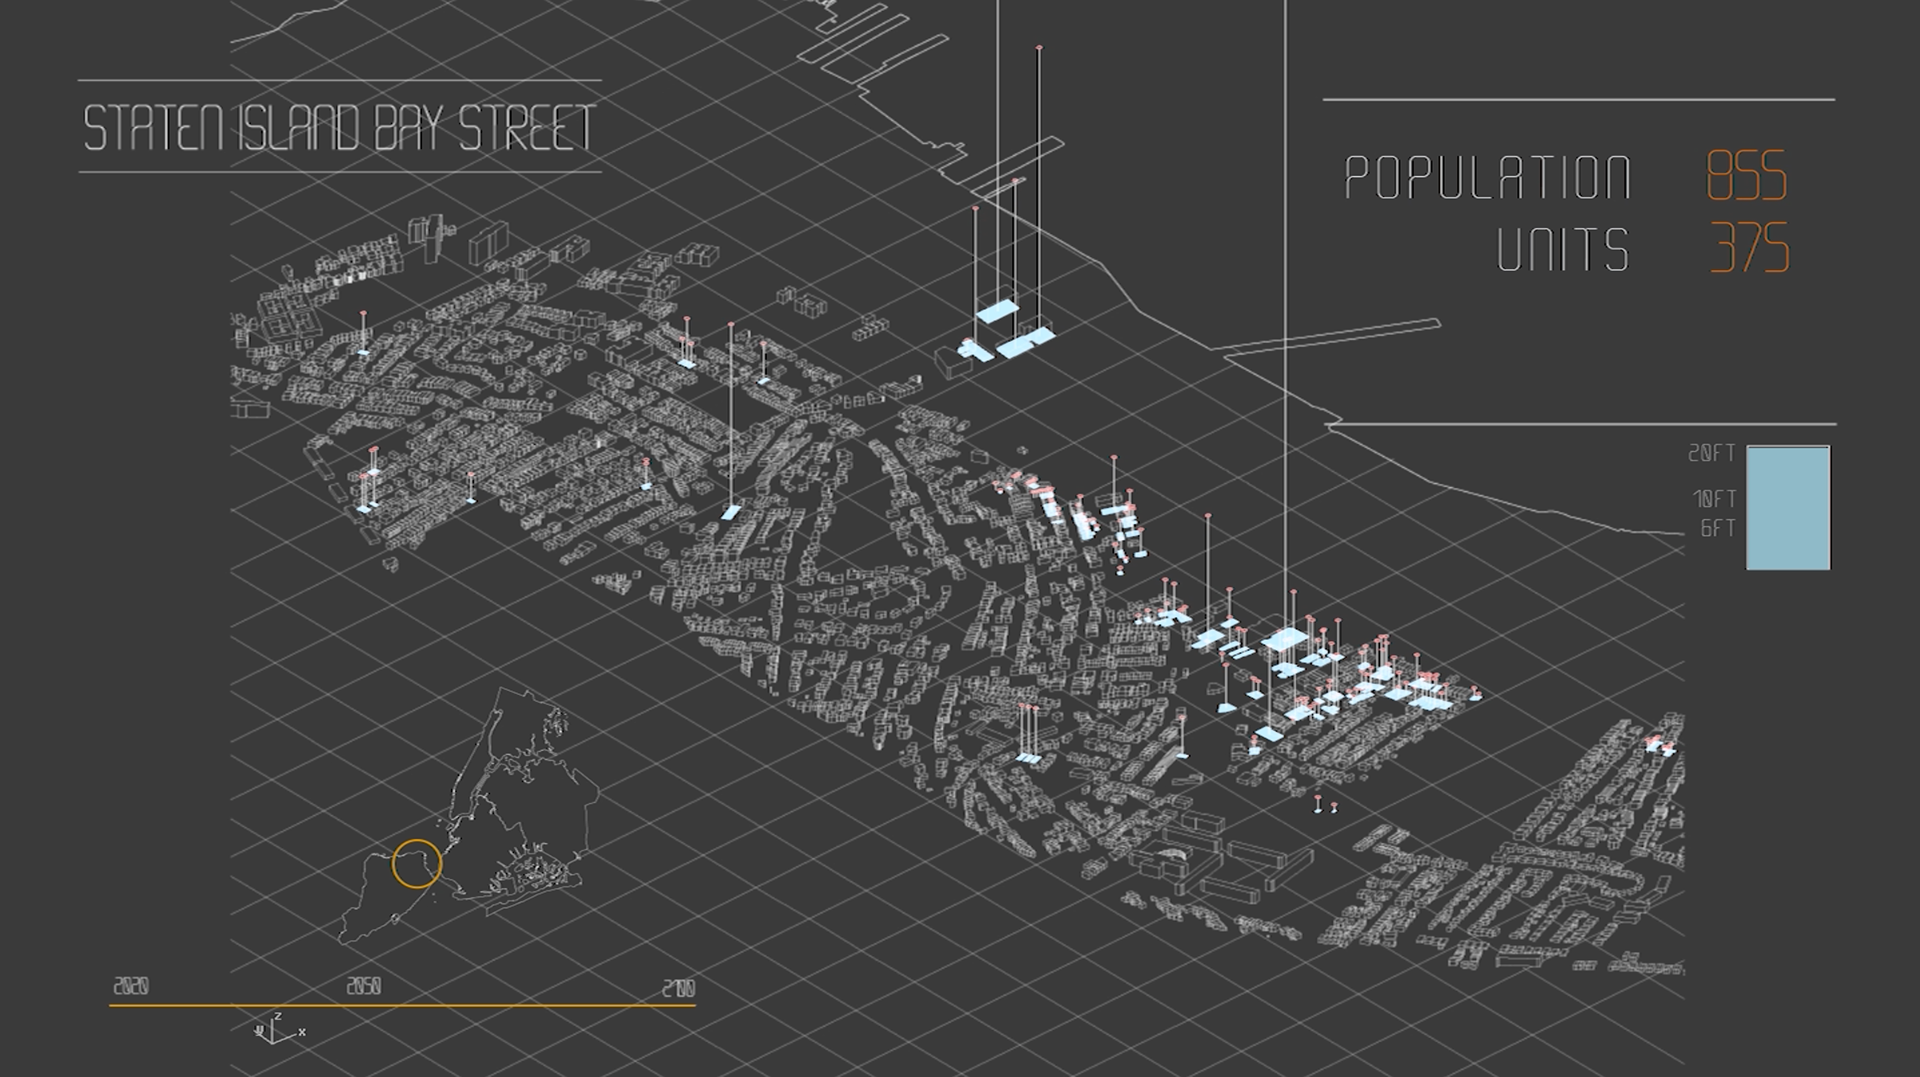
The challenge was that a standalone GIS analysis wouldn't have provided the number of floors and number of units affected with water level rise. Hence the need to import this dataset into rhino for a 3d analysis with grasshopper.
PROCESS
01. GIS
base shapefiles for building footprints and flood level data
02. Rhino
Visualise the operations
03. Grasshopper
import GIS files, get the heights of the building, and then get number of floors per building. aprroximate the number of units and occupany per floor. Animate with for loop.
Below is a link to the project video.


